Quantcast
Channel: TIBCO Mashery API: Blog
Viewing all 224 articles
Browse latest View live

New feature: Call Inspector

$
0
0

We are pleased to announce the general availability of Call Inspector – a tool that will allow you to debug API calls as they flow through Mashery Traffic Manager. With this tool, you are able to respond faster to problems reported by your API users by being able to narrow down issues with their API calls. Additionally with the tool you can gain insight into historical transactions for auditability.  

The feature allows you to turn on call capture (or verbose logging) for a specified duration with all-inclusive criteria or by filtered criteria e.g. specific APIs and end-points, specific status codes etc. Verbose logging is produced for calls that meet the call capture criteria.

The call viewer tool allows you to drill down into each call that has a verbose log available in the system . You can review details such as the call request as it hits Mashery, as its processed by Mashery before being submitted to API back-end system, response as its delivered by back-end system and response as its processed by Mashery. This level of visibility also allows you to drill down and narrow down the problem area and address questions such as whether the issue is due to processors applied for that API end-point or not. Call viewer tool also provides ways to filter out calls for viewing by criteria such as API Key or Package Key so you can zoom in on specific problem calls quicker.


Call Inspector has a number of access control and management features as well.  It's an optional and controlled feature that some users with APIs that have security and privacy oriented requirements may not want to utilize or restrict which endpoints are enabled.  You can control which employees may turn on the feature and for which specific data flows.  You may control which employees may view the log content.  The system also automatically generates notifications to email groups that wish to be informed when the tool is used.  Finally, any service that is marked as requiring high security rules will never be logged by the system period. 

The feature is available for use by all Mashery customers up to a certain consumption level depending on the Mashery plan you are subscribed to. For details on enabling this feature for your area, please contact Mashery Support or your Mashery Customer Program Success Manager


Improved CORS support in Mashery

$
0
0

With the release last night, Mashery has added yet another useful feature based on your feedback!

CORS (Cross Origin Resource Sharing) is a W3C standard that defines how browsers and servers can interact with one another and provides a mechanism for web applications to make requests to a resource in another domain. All major browsers support this standard. Mashery has made it easy to leverage this standard with just a  few button clicks and without requiring changes to your back-end API server. In addition, by using this optional feature available in Mashery, you can offload pre-flight request / response management to Mashery. That is, if a valid pre-flight request comes through, Mashery will prepare an appropriate pre-flight response with the right headers as well as perform the necessary validations on whether the requested method is allowed on the API end-point.

Below is a screen-shot of these new settings that are available while configuring your API end-points

New Feature: Event Trigger API

$
0
0

We are pleased to announce the release of the Event Trigger API, a new way to integrate your API related business processes and systems with the Mashery platform.  The Event Trigger API makes it easy to connect these business systems, e.g. a 3rd party CRM product, internal data warehouse or custom billing solution, with the Mashery processes and data that drive your API program.  Whether performing custom validation rules to ensure that developers who are signing up to the portal are desired or appropriate to supplementing developer or application data in the Mashery database with information stored in your own system to simply recording the issuance of new keys for applications in a separate, non-Mashery database, the Event Trigger API is a real-time integration tool, allowing you to both streamline processing by forgoing potentially more complex integration paths as well as to generate a better user experience that works in line with your business.

The Event Trigger API is configured through the Mashery Dashboard and authorized individuals pick and chose the business objects of interest and when to receive data and notifications.  There is a simple testing tool that enables you to understand the flow of the data and get you more familiar with the feature.  The API is documented here.  A screenshot of part of the configuration UI is show below.


Please contact support@mashery.com for more information and to have this feature turned on for you.

API Data volume trends now available in Mashery

$
0
0

Mashery is pleased to announce the availability of a new set of reports that enables customers to quantify the volume of data being served through their API program. This represents the latest way that Mashery is supporting the efforts of our customers to widely broadcast the achievements of their API programs to other internal stakeholders and to the broader public audience alike.

I look forward to seeing the exciting new ways that customers seek to define their API achievements using data-oriented definitions. Remember that comparing data quantities hinges on how you define itFor example, the 5 gigabytes (5 x 10^9 bytes) of storage capacity contained within the original iPod was touted as holding “1000 songs in your pocket.”[1] A “Library of Congress” worth of data based on current estimates amounts to 15 terabytes of data (15 x 10^12 bytes).[2]

This new report, entitled Data Served, can be found within the Reports section of the Mashery Administration dashboard and is automatically turned on for all customers.

Below is a screen-shot of the new Data Served report for a selected Package & Plan

Below is a screen-shot of the new Data Served report for a selected API Service

References:

[1] http://support.apple.com/kb/HT1353

[2] http://blogs.loc.gov/digitalpreservation/2012/04/a-library-of-congress-worth-of-data-its-all-in-how-you-define-it/

Mashery Local 2.1 is now available !

I/O Docs: Changes to Access Token Request

$
0
0

Based on feedback and to be in line with the OAuth 2.0 specification, Mashery has made a small but important change to the way I/O Docs makes requests for OAuth access tokens. 

Who's affected: Depending on your OAuth 2 access token provider's implementation, you may need to modify it to receive the token request credentials in the Authorization header. This is the compliant way to receive credentials and will successfully work with I/O Docs. For customers using Mashery OAuth Accelerator, no change is required.

Issue: I/O Docs was incorrectly passing credentials in the POST body (URL encoded) and the Header. This is not in compliance of the spec and will  result in a 400 (invalid_request) in the response from the authorization server. 

Whats changed: I/O Docs will send the client ID/secret pair in the Authorization header. This change is necessary to comply with OAuth2 spec RFC, ttp://tools.ietf.org/html/rfc6749#section-5.2

Necessary Action:Modify your authorization code to receive the token request credentials in the Authorization header. This is the compliant way to receive credentials and will successfully work with I/O Docs

If you're impacted by this change, we appreciate your time to make the minor modification on your end. We'll continue to make improvements to I/O Docs based on your feedback. 

New Feature: Spotlights Reports

$
0
0

Mashery is pleased to announce the release of Spotlights, a new set of reports that enables our customers to enjoy unprecedented levels of visibility into the performance of their API programs.

The new Spotlights set of reports have been designed to answer a diverse collection of interesting business questions through new data visualizations depicting the behavior of individual developers and the overall API program alike. Customers can find the Spotlights section under the Reports Tab in the API Usage navigation area.

I look forward to seeing the new and exciting ways that our customers gain a competitive advantage by utilizing these data visualizations of their API program data.

The Spotlights report entitled “Historical Call Volume Trends” is designed to provide customers with the tools to identify developers who have:

  • an increasing trend of consuming the API data and would be excellent candidates for potential showcasing broadly in future communications
  • a decreasing trend to consuming the API data and would represent opportunities for an API program account manager to proactively engage

The Spotlights report entitled “Error Volume Trends” is designed to provide customers with the tools to identify developers who have:

  • a trend of unsuccessfully consuming the API data and would benefit from additional guidance or documentation on best practices

The Spotlights report entitled “Historical API Usage Limit Enforcement Trends” is designed to provide customers with the tools to identify developers who have:

  • a trend of exceeding the current API data consumption limits applied by the API provider with regard to the daily quota of requests allowed (Quota) or to the allowed calls-per-second (QPS).

The Spotlights report entitled “Hourly Call Volume Trends” is designed to provide customers with the tools to identify:

  • trends in the overall hourly demand pattern of the API program with respect to the distribution of successful or unsuccessful consumption of API data

New Feature: Program-wide API Call Reports

$
0
0

Mashery is pleased to announce the availability of a new report that provides customers program-wide visibility of API call volumes across their entire product offering. 

This new report, entitled API Call Volume by Service and Type, can be found in the Reports section of the Mashery Administration dashboard within the summary page, and is automatically turned on for all customers. Customers using the API Packager feature would see a similar report entitled API Call Volume by Package and Type.

This release represents the latest way that Mashery is providing guidance to our customers to identify interesting program components that would be great candidates for additional review time of the associated business and technical metrics.

Below is a screen-shot of the new report for a selected API Service:

This report also makes use of the common additional drilldown into each API Call type:


Mashery Local 2.2 Released !

$
0
0

Mashery Local 2.2,  with new and improved tools for Mashery Local Operations and Support staff is now available ! With this release, tools are available to assist with debugging any issues with API calls as they flow between client application, Mashery Local and your API back-end system . In addition, tools that help gather diagnostics and address Mashery Local configuration issues are also available

The tool to introspect API call data is enabled via a simple control on the Mashery Local Cluster Manager UI interface. For the duration this is enabled, Mashery Local will produce verbose call data logs that can be written out to a local location or a shared NFS location. The tool has an auto shut-off capability when the timer expires.

Each API call produces a directory that is stamped with the Mashery Message ID – a globally unique identifier for each call that flows through Mashery. If you are not familiar with using Mashery Message ID in your request /response headers to create a golden thread between your partners, Mashery and your back-end systems, see this post. Using this GUID, your support staff can quickly drill down to the call logs for the problem API call.

For each API call’s verbose data logs, you can review details such as the call request as it hits Mashery, as its processed by Mashery before being submitted to API back-end system, response as its delivered by back-end system and response as its processed by Mashery. This level of visibility into call data helps address questions such as whether the issue is due to the processors applied or the API back-end system.

Apart from this verbose call data logging facility, this release also includes a debug utility made available via a command line console. The debug utility provides several options to the user, some come in handy when you need to gather Mashery Local system health information to diagnose common system configuration errors on Mashery Local. Other options are useful to resolve some issues identified as an outcome of the diagnosis.

For customers with a Mashery Local license, please contact us at support@mashery.com to obtain the image and release notes.

New Feature: Cache reports

$
0
0

Mashery is pleased to announce the release of a new set of reports that enables our customers to enjoy new levels of visibility into the API performance benefits provided by our caching feature.

These newest reports are available for all customers and can be found with the Reports tab of the Administration dashboard as follows:
For a selected Package or Service > System Status > Cache

Each of the new reports can also be filtered to a particuilar Package and Plan.

The report entitled “Overall Percentage of Call Responses Served” is designed to provide customers with the tools to quantify the aggregate volume of API calls served from each source: the Mashery Cache vs. the customer’s backend infrastructure a.k.a. the Origin.

The report entitled “Percentage of Call Responses Served” is designed to provide customers with visibility into the trending for the volume of API calls served from each source.

I look forward to seeing the new and exciting ways that our customers further adopt the caching feature to improve their downstream user experience.

New Feature: Chart and Legend Interactivity

$
0
0

New Feature: Chart and Legend InteractivityMashery is pleased to announce the release of a new report drill down feature that will revolutionize the way our customers extract insights from our reporting and analytics offering.

This new enhancement is available for all customers and is applicable throughout the reports portfolio.

Our customers can now drill-down to specific content by either 1) clicking on the legend entry for the interesting content 2) clicking on a data point associated with the interesting content.
If at any time our customer can click the newly visible “Reset Chart” button to return to the original chart state.

See diagram below for additional details.

This reporting and analytics enhancement serves as the latest way that Mashery is committed to delivering a steady stream of innovations to our customers.

New Features in I/O Docs

$
0
0

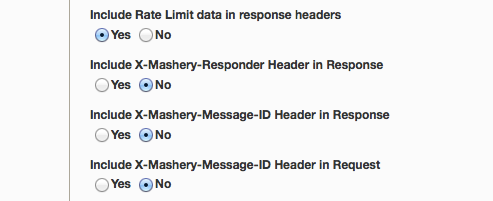
We’re pleased to announce the release of several updates to the ever popular I/O Docs tool including

  • SOAP support in I/O Docs
  • New custom forms engine using Alpaca
  • New JSON editor, Ace


SOAP Support in I/O Docs

File this one under "teaching a new dog, old tricks." With I/O Docs support for SOAP APIs, providers can now offer developers a modern tool for a mature protocol. This is especially useful for large enterprises who currently have (or plan to make) their SOAP APIs available but have no easy way to help their developers explore their service. SOAP based web services certainly have their challenges but learning and discovery of the API shouldn’t be one of them. If you happen to be using SOAP to expose webservices, in just a few clicks, you can bring the simplicity and power of I/O Docs to your developer audience.

I/O Docs will parse and convert an imported WSDL (XML) into JSON format to generate interactive documentation for both secure and non-secure APIs. Developers simply enter parameter values and make live API calls. SOAP support goes beyond just building an interactive UI based on the schema, types, and bindings; when a developer clicks “Try it”, I/O Docs retranslates the JSON objects into XML based SOAP calls and displays the requests/response data, making the learning experience for the developer instant and enjoyable - surely easier than having to generate a third-party SOAP client that generates business-object interfaces and network stubs. By bringing a new school experience to an old school model, I/O Docs makes it easy for enterprise customers to take advantage of the tool of choice for interactive API documentation.

If you’ve already enabled I/O Docs in the Mashery portal, setting up I/O Docs for SOAP APIs requires no additional configuration or curation of the original definition; the WSDL provides everything I/O Docs needs in order to power itself.

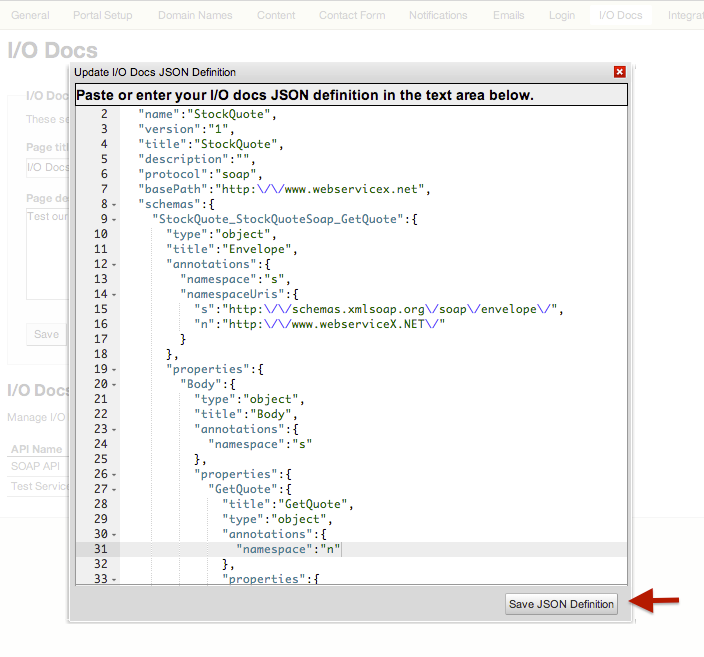
1. From the I/O Docs dashboard, import a WSDL by pointing I/O Docs to a URL


IO Docs Admin Settings

Import WSDL URL


2. Save the translated definition


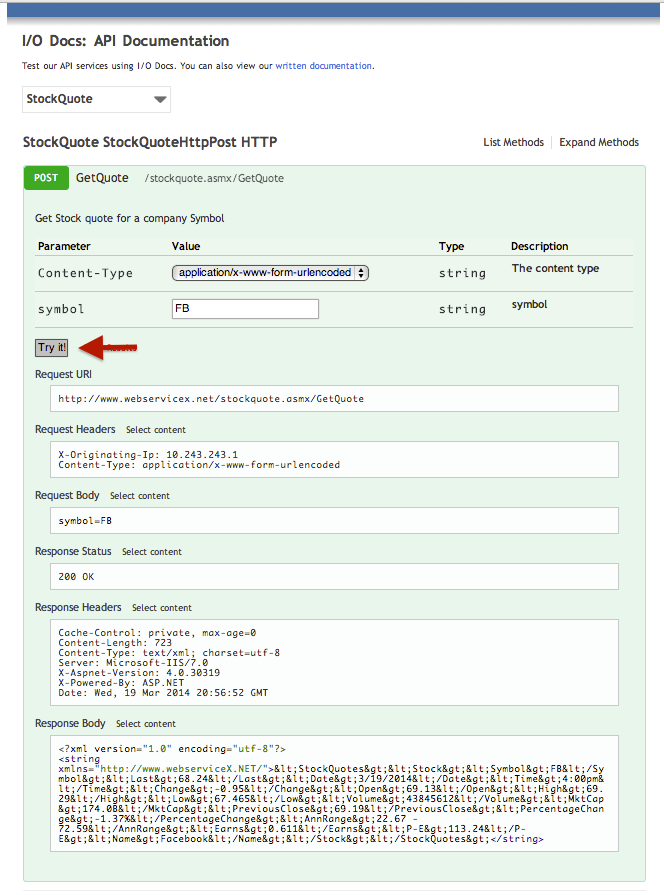
3. Make SOAP API calls from I/O Docs


I/O Docs WSDL requirements

As with all things SOAP, things can sometimes get complicated quickly. We did our best to adopt common practices in our translation of WS-Security, Schemas, and Types, but there are  a few “rules of the road” when using WSDLs to generate I/O Docs; we've written them up and made them available here. Though this is by no means the final definitive list, the guide will help make the journey as smooth as possible.
 

Schemas and Forms - I/O Docs revs up it’s forms engine

I/O Docs definition now includes request schemas to describe the data accepted by API methods (for PUT and POST). Though schemas are not required by I/O Docs, they can be used to do some pretty neat things as shown in the example below. I/O Docs has borrowed the schemas concept from Google Discovery Document Format  which in turn is based on JSON Schema V3 for its schema representations. I/O Docs now also makes use of Alpaca jQuery form to provide custom forms based on JSON schema.

Combining the use of schemas with Alpaca* engine, you can now create custom form fields to send JSON objects in the form post. This obviates the need to embed JSON in a text area (yuk!), and removes the potential for other not-so-desired side-effects (e.g, url-encoded POST); the plain truth of it is, I/O Docs becomes easier to use for your developer audience while staying true to your API. 

The brief example below uses a schema definition, “Widget”, to generate a custom form request for the “InsertWidget” method.

A the top of the I/O Doc definition, a schemas object is created and within it, the Widget is defined.


"schemas":{"Widget":{"id":"Widget","type":"object","properties":{"name":{"type":"string","description":"The name of this Widget."
            },"description":{"type":"string","description":"A full length description of this Widget."
            }
         }
      }
   }


...in the resources section of the I/O Doc definition, the “Widget” schema is referenced in the method request.

"resources":{"Test Endpoint":{"methods":{"insertWidget":{"description":"","httpMethod":"POST","path":"/post","request":{"$ref":"Widget"
               }
            }
         }
      }
   }


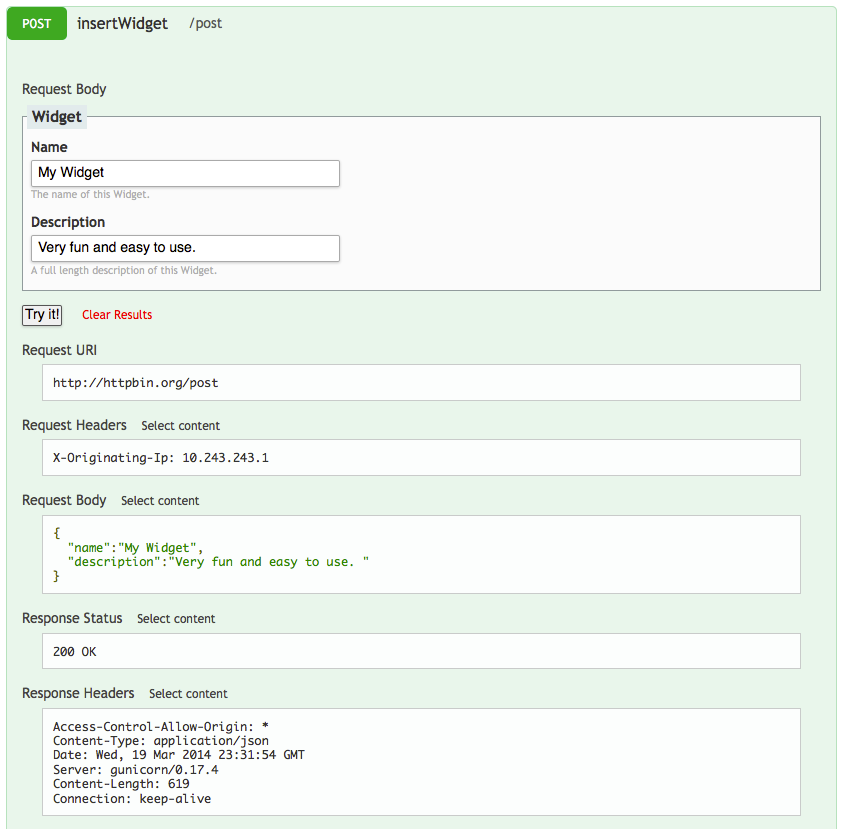
The definition is rendered in I/O Docs as followed. Note that the request body paramater of insertWidget is JSON .


Ace JSON Editor

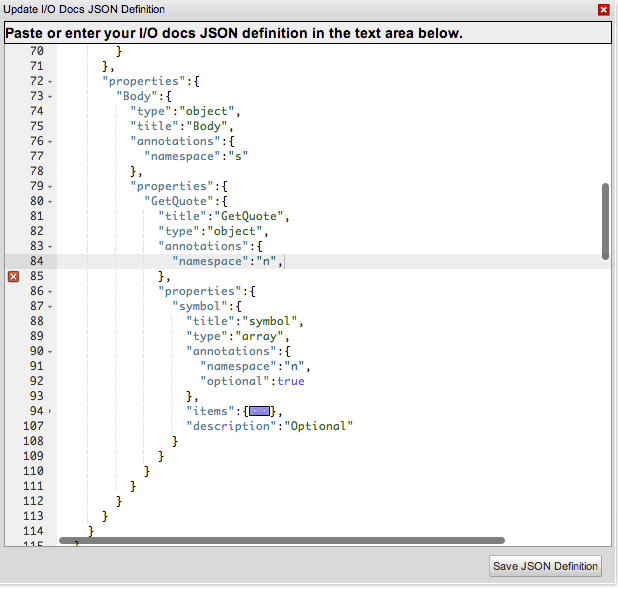
We’ve replaced the I/O Docs editable textarea field with the widely used Ace** editor to deliver full blown code editing functionality including: In-line JSON validation, code folding, syntax highlighting and a whole lot more.  Thanks to the folks at Cloud9 IDE, Mozilla, and all the developers who contributed to building this amazing editor! Here's a screenshot of Ace in I/O Docs


* Alpaca is a community-led open-source project licensed under Apache 2.0.
** The Ace source code is hosted on GitHub and released under the BSD license ‐ very simple and friendly to all kinds of projects, whether open-source or not.

Heartbleed Exploit Security Update

$
0
0

As you are probably aware, OpenSSL released a security advisory yesterday, April 7th, regarding a serious vulnerability nicknamed “Heartbleed”, which impacted a large number of Internet applications and services. The vulnerability allowed an attacker to steal private certificate keys or even gain access to data in memory of a vulnerable SSL server. Mashery, along with its service providers, has addressed this vulnerability and believes it has been resolved.

Prior to resolution, some Mashery customers may have been affected by this vulnerability though there is no log information associated with this exploit that allows Mashery to determine whether any systems were compromised. Customers exposed to the vulnerability included only those on the Mashery Enterprise network utilizing SSL certs to enforce secure communication between their consumers and Mashery SaaS systems. API traffic for Customers on Mashery's Premium Network and API traffic managed via Mashery Local were not exposed to the threat.

Mashery’s Enterprise network utilizes Amazon Web Services, which incorporates Elastic Load Balancers (ELBs) in traffic management. Amazon has issued statements today containing information on the vulnerabilities with ELBs as well as other Amazon offerings along with resolution information. According to their release, all AWS regions utilizing ELBs have been patched. Mashery is continuing to monitor any additional information released by Amazon and additional, related threats.

If you are using Mashery’s Enterprise SaaS edition with SSL transport on API traffic (SSL on the Mashery developer portal is not in scope for this vulnerability), we recommend that you replace your SSL certificate. To begin this process, please open a support ticket with Mashery via self service portal (mashery.com/selfservice) or by emailing support@mashery.com and our support group will walk you through the process.

We at Mashery continue to take security very seriously and are taking all measures possible to address this. Mashery continues to evaluate this vulnerability to determine if any additional systems were at risk during the vulnerability period. Mashery will provide any updates as they are available. Thank you for your patience on this issue. As always, please feel free to reach out to us if you have any additional questions or concerns.

Heartbleed Update

$
0
0

While the actual threat window has been closed, we have been working actively with our customers to rotate SSL certificates. We are also continuing to follow through with assessing any additional risks and remediation steps as necessary. 

As a reminder, if you are deployed on the Mashery Enterprise network and have not already done so, please open a support case to begin the process of swapping out your SSL certificates.  If you have questions or concerns or are not sure if you are using our Enterprise network, please contact us at support@mashery.com

Heartbleed update 4/15/14

$
0
0

It has been a week since the initial reports of CVE-2014-0160, aka the Heartbleed exploit.  Over this time we have been working closely with our customers to assist those who might have been exposed to this vulnerability in performing their own risk assessments based on their knowledge of their own systems and the information that we have provided. The purpose of this coordinated investigation is to allow customers to determine their level of risk and execute any required mitigation steps.

For Mashery, this has meant reviewing our infrastructure and connection points with customers to provide that all appropriate systems have been patched and any necessary certificates and credentials have been rotated as security best practices demand. We have sent out multiple communications directly to customers as they relate to specific threat vectors  and continue to work with them to install new customer certificates as they come in.

The task of evaluating the risk not only to Mashery but also to our customers has been one that we have not taken lightly. We will continue to stay on top of this issue and message out as appropriate.  Please contact us at support@mashery.com should you have any questions or feedback about this process.


New Feature: Expanded Cache reports

$
0
0

Mashery is pleased to announce the release of an new expanded set of reports that enables our customers to enjoy new levels of visibility into the API performance benefits provided by our caching feature.

Now, API administrators can drill-down into their technical asset hierarchy and visualize the percentage of traffic that is delivering responses from Mashery's Cache feature or from their backend technical infrastructure. Once filtered, the data table transitions to an interactive data visualization for further investigation and insight generation.

Cache utilization reports are available for all customers and can be found within the Reports tab of the Administration dashboard as follows:
For a selected Package or Service > System Status > Cache

Please see the screenshots below depicting this exciting new feature:


Cache optimizations with If-Modified-Since

$
0
0

We are excited to announce that with last night’s release, Mashery has included additional caching optimizations around handling If-Modified-Since header. This HTTP header can be quite useful to improve response times and reduce traffic bandwidth between client applications and your API back-end systems. The way If-Modified-Since header works is very simple. It simply allows any system that honors this header to evaluate if content has been modified since the date specified in the request. If content has not been modified since the date, the system responds back with “304 Not Modified” without sending back the entire payload. This way client applications can reliably use local caches to fulfill responses, speed up response times and avoid unnecessary response payloads getting downloaded from API back-end systems

To understand how this works and to benefit from this feature, you must first enable Mashery cache for the API end-point.

If an application sends a request with If-Modified-Since header against that end-point, Traffic Manager will first check if a valid response can be delivered from cache. If Mashery cache has a valid response, Traffic Manager will evaluate if the cached response needs to be revalidated against API back-end system based on additional directives such as “max-age”, “s-maxage”, "must-revalidate”. If revalidation is not called for, Traffic Manager will return back with a “304 Not Modified” response avoiding request / response roundtrip to the API back-end system. Even if revalidation is called for, Traffic Manager performs additional optimizations and converts the request to a conditional request to minimize traffic bandwidth to your API back-end system. If the API back-end system responds back with “304 Not Modified” in this case, Traffic Manager will deliver the valid response from Mashery cache. If the API back-end system responds back with a “200 OK”,  response is delivered as usual to the client application and updated in cache.
 

OpenSSL Exploit - SSL/TLS MITM vulnerability (CVE-2014-0224)

$
0
0

OpenSSL has released a new exploit notification (CVE-2014-0224), and as with all such exploits, Mashery is working to identify and patch any systems that might be subject to this exploit.

Unlike the previous HeartBleed exploits, we believe this vulnerability did not expose any customer certificate or private key information to an attacker. Whereas, with HeartBleed, customers were required to rotate out their Certificates and generate them with new Private Keys, in this case there is no action needed on the part of Mashery Customers.

We will be providing updates as more information becomes available on this or other security related topics.

Please don't hesitate to contact us via support@mashery.com or via the self service portal (mashery.com/selfservice) should you have any further questions.

Best, Scott

================================
Scott Farnsworth
Director, Technical Services  |  Mashery, Inc.

New Feature: Enhanced Cache Reporting and API Distribution Network

$
0
0

We are pleased to announce the general availability of enhanced Cache Reporting, the latest addition to the Reporting & Analytics provided within the API administration dashboard.

API administrators can now drill-down deep into their API programs and visualize the percentage of API responses that are being delivered from the Mashery cache feature or from their backend infrastructures.

Now, API administrators can proactively identify opportunities to unload non-transactional API traffic from consuming their backend capacity and instead leverage TIBCO Mashery’s globally distributed API distribution network. Customers delivering static data or rich-media content like videos, music, articles, etc…, who have optimally configured their use of the Mashery cache feature would see improvements to their API response times and, for any mobile-deployed products, a seemingly “faster” end-user application experience as data is transferred in less time.

The new reports provide a "birds-eye view" across Packages, Plans, API’s, Endpoints, Methods and developers. Each drill-down perspective contains a pair of reports for an overall assessment and a time-trended assessment of how the Mashery cache feature is being utilized. A key benefit of this deep visibility into cache utilization is the potential for our customers to influence internal discussions on how to improve the backend infrastructure with respect to the indicated traffic trends for APIs, endpoints, and methods.

When filtered, the report data tables transition smoothly to become an interactive data visualization for further inspection and insight generation.

The new reports are available for all customers who have the cache feature enabled and can be found within the Reports tab of the Administration dashboard at the following location: For a selected Package or Service > System Status > Cache.

Please see the screenshots below depicting this exciting new feature in action!


Rate limit consumption via debug headers

$
0
0

We launched a useful little feature recently that allows monitoring of rate limit consumption.  This is a feature that needs to be be toggled on via a UI option to be available. When this feature is toggled on, all responses returned from that end-point will automatically include a bunch of Mashery generated headers that display information such as allotted QPS, allotted quota, current QPS, current quota as well as time duration left to quota reset. Useful for e.g. if a developer runs out of allotted daily quota and needs to know when the next call can be made against that end-point.

For e.g. with this option enabled, if a developer is making a call using a package key for a package plan that has method level limits specified, below are some headers that would be included into the response by Mashery
X-Plan-QPS-Allotted
X-Plan-QPS-Current
X-PlanMethod-QPS-Allotted 
X-PlanMethod-QPS-Current 
X-Plan-Quota-Allotted
X-Plan-Quota-Current
X-PlanMethod-Quota-Allotted
X-PlanMethod-Quota-Current

Here’s the screenshot of where you would enable this option via Endpoint -> Properties page ( Include rate limit data in response headers)


Viewing all 224 articles
Browse latest View live